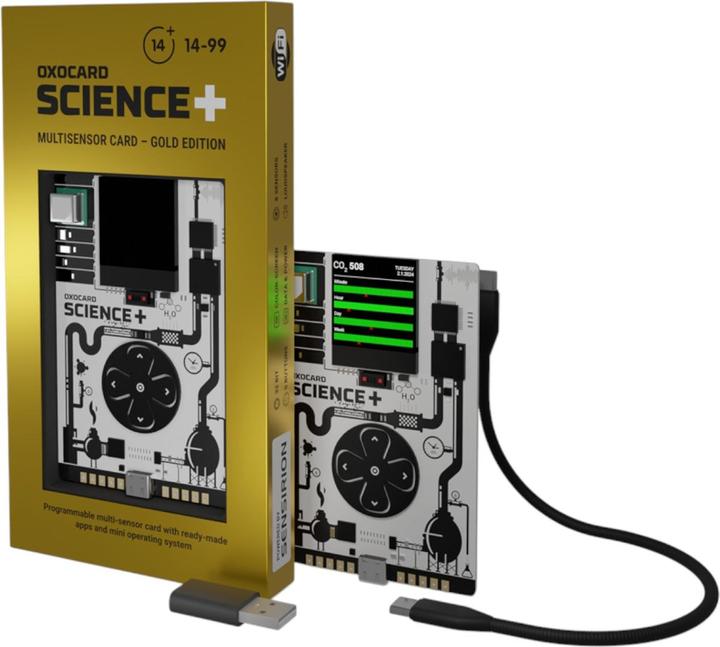

Measuring indoor air quality: Wuerfeli vs. Oxocard Science Plus
The Oxocard Science Plus can be used to check the quality of indoor air among other things. The card’s freely programmable, so I can use these measurements for whatever I want. I’m replicating the pyramid-shaped air quality measuring device Wuerfeli by QE and adding a few additional functions.
QE’s Wuerfeli and Oxon’s Oxocard Science Plus have a few things in common. Both of them stem from a Swiss company, measure carbon dioxide levels of the air and use the Sensirion SCD40 CO₂ sensor, which is also made in Switzerland. This makes them suitable as ambient air metres. In closed indoor spaces, the CO₂ content rises steadily and indicates if a room needs airing out.
But that’s about all they have in common. If anything, the two products are opposites. The Wuerfeli’s a very simple device that doesn’t need to be configured. It’s plug-and-play. The disadvantage being that Wuerfeli is a one-trick pony. In other words, it only does exactly what it was intended to do.
The Oxocard’s the opposite. It’s a freely programmable microcontroller with several measuring sensors. In addition to measuring CO₂, it can also check humidity, brightness, temperature, air pressure, distances and sound. So it’s up to you how you want to use it. The Oxocard offers a simple programming interface that allows you to put your own ideas into practice. I go into the concept in detail in this article.
The Science Plus model is brand new. Compared to the previous Science model, this one stands out mainly because of additional and improved sensors and a built-in speaker.
Oxocard Science Plus as a Wuerfeli replica
To test how flexible the Oxocard is, I try to turn it into a cube.
The Wuerfeli displays four colours depending on the air quality. Blue for mountain air, green for good, orange for a bit stuffy, red for very stuffy. The colours represent the measured CO₂ value:
- blue = up to 550 ppm (parts per million)
- green = 550 bis 1,000 ppm
- orange = 1,000 bis 1,600 ppm
- red = over 1,600 ppm
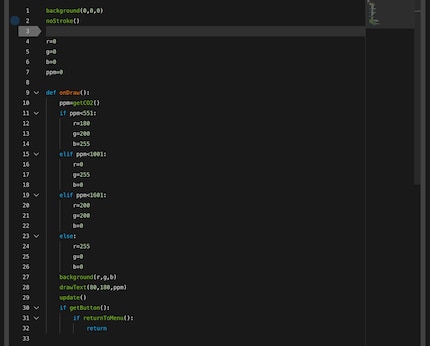
Seeing that the Oxocard can be freely programmed, this should be easy to replicate. Time to try it out. And lo and behold, in just a few minutes I’ve programmed a script that displays the right colour depending on the CO₂ value. In addition, the corresponding ppm value is displayed. It’s really very simple.
Source: David Lee
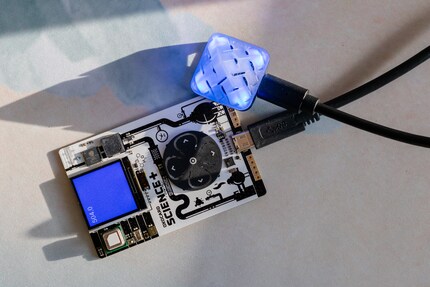
However, I have to admit that my replica doesn’t come close to the original Wuerfeli, which has a bright, three-dimensional display you can see from all sides. The colours don’t just change abruptly but transition and the display pulsates when you’re letting fresh air in. It dims its brightness when there’s little ambient light and switches off completely at night. In other words, it won’t disturb you when you’re falling asleep and will use less power at the same time. The 5,000 mAh battery keeps going for at least three days. The same battery only lasts about one day with the Oxocard and its screen that’s switched on all the time.
At least I’m sure I can improve the Oxocard’s display. So I start working on a new version of the script.
Source: David Lee
Prettifying the display
I’d like the colours to bleed into each other instead of changing abrubtly. An animation would be nice, too. As I have zero clue how to go about this, I take a look at a few example programs and find what I’m looking for in Simple Clouds. The program displays a moving colour gradient by means of one basic colour and different brightness values.
I apply the example to the CO₂ colour code. I would’ve preferred the animation to be a little calmer and subtler, flowing from the corners to the middle. Unfortunately, I don’t know how to adapt the script for this, nor if it’s possible at all.
Instead, I program a gradient starting at the corners myself using circles of colour. The result? Meh. Ultimately, a single circle in the middle looks nicer. In the end, I’m happy with that, even if it doesn’t come close to the Wuerfeli look.
Dimming the screen
The Oxocard Science Plus features a brightness sensor. On its own, it’s not much use to me. But after going through the documentation, I find out that the screen backlight can be dimmed or switched off completely with the «backlight()» command. This means I can get the Oxocard to adjust the screen brightness to its surroundings.
I modify the script to make the animation stop when it’s completely dark. After all, it wouldn’t be visible anyway. But the data continues to be logged.
The Wuerfeli mechanism is a bit more sophisticated. It only switches the display off when the surroundings have been dark for some time. This could also be programmed in the Oxocard.
But the dimming feature means the device isn’t interfering with my sleep when it’s set up in the bedroom. In theory, it should also consume less power when dimmed; in practice, however, the battery doesn’t last noticeably longer. It’s probably the processor that consumes most of the power.
Warning signal
Even the best replica of a Wuerfeli’s never going to be as good as the original. And that shouldn’t be the aim of the game anyway. Instead of trying to perfectly replicate the Wuerfeli, I give my CO₂ program a few additional functions the Wuerfeli doesn’t have. First up, I make use of the built-in loudspeaker. I want it to emit a warning sound when the colour changes to indicate poorer air quality. This makes up for the fact that the Oxocard display is only clearly visible from the front.
When the colour switches from blue to green, it beeps once. From green to orange triggers three beeps. And finally, from orange to red, you’ll hear five longer beeps.
Data recording
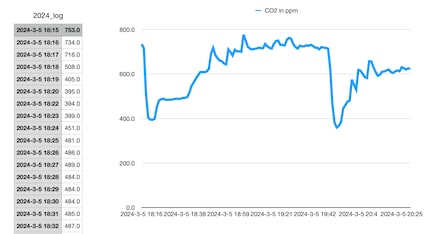
With the Oxocard you can permanently record the measured date, i.e. by saving them in a file. There’s a sample script for Science Plus that saves and displays the CO₂ values for an entire week. Even if the script stops or the card’s disconnected from the power supply, the data’s retained and recording can be continued the next time the program’s started. By changing a single line in the script, it can also log the temperature or humidity instead of CO₂.
However, the script saves the data in a binary format, which means I can’t do anything with it on the computer. For this reason, I program my own log file in CSV format. I can then import this into Excel or another spreadsheet program.
Source: David Lee
Currently, I have no use for this data. Maybe it could be useful to record the temperature and humidity like this and place the sensor in a room I rarely use. The great thing is that I can expand and adapt it at any given time.
The last addition for now is that the script displays the average value of the current session when I press one of the arrow keys. But again, I have no use for it at the moment. I created it purely for the fun of tinkering.
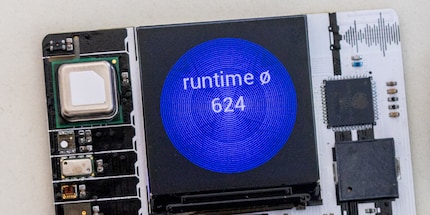
Source: David Lee
The Oxocard’s what you make of it
My replica of the Wuerfeli cube’s anything but perfect. However, it does confirm that you can turn the Oxocard Science Plus into a measuring device according to your own ideas – be it something as simple as the cube or a sophisticated data analysis tool.
This takes time and patience. So the main thing is that you enjoy programming if you’re thinking of getting the Oxocard Science Plus.
The Wuerfeli, on the other hand, is perfect for anyone who has neither the time nor inclination to get to grips with the device. It requires no training, no configuration, nothing. It’s quite literally plug-and-play. Plus it will encourage you to air the room as well as any other CO₂ measuring device.
But even with the Oxocard, you don’t have to program everything from scratch yourself. There are numerous sample scripts available. Feel free to continue using what I programmed for this article. Just click here to download.
My interest in IT and writing landed me in tech journalism early on (2000). I want to know how we can use technology without being used. Outside of the office, I’m a keen musician who makes up for lacking talent with excessive enthusiasm.
Interesting facts about products, behind-the-scenes looks at manufacturers and deep-dives on interesting people.
Show all